TEST: Patriot P320 512GB M.2 SSD
Here you can find a detailed performance and benchmark test of the M.2 NVMe SSD P320 with 512GB (P320P512GM28) from Patriot.3817
0,16 $
| Technical data | |
| Image | 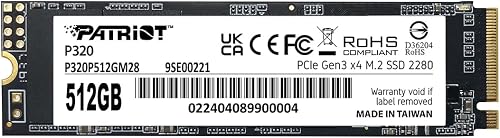
|
| Manufacturer | Patriot |
| Model number | P320P512GM28 |
| Storage capacity | 512 GB (477 GiB) |
| pSLC-Cache | 64 GB approx. |
| Read speed | 3000 MB/s |
| Write speed | 2200 MB/s |
| Interface | PCIe 3.0 x4 |
| Connection | M.2 2280 |
| Memory module (NAND) | TLC |
| DRAM Cache | no |
| TBW (Total Bytes Written) | 240 Terabyte |
| Controller | Maxio MAP1202 |
| Price | ca. 80 USD (= 0,16 $ / GB) |
| Paid link | Buy on Amazon |
Compared to the top performer*
*) Test result evaluated according to AS SSD Score within the same size.
AS SSD Benchmark
Standard performance test
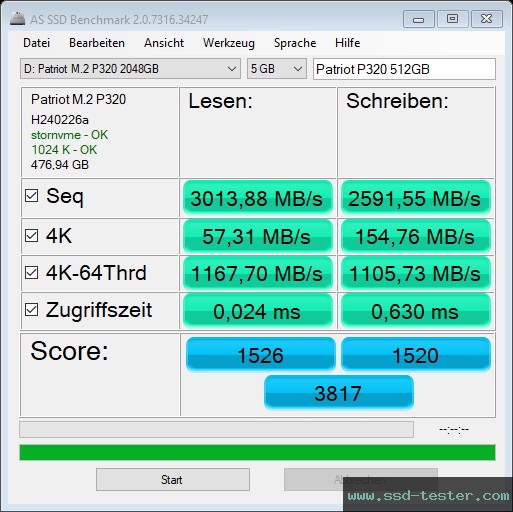
The standard test was performed using a 5 GB file. A total score of 3817 points was achieved.
| AS SSD | Read: | Write: |
|---|---|---|
| Seq in megabytes per second |
3013,88 MB/s |
2591,55 MB/s |
| 4K in megabytes per second |
57,31 MB/s |
154,76 MB/s |
| 4K-64Thrd in megabytes per second |
1167,70 MB/s |
1105,73 MB/s |
| Access time in milliseconds |
0,024 ms |
0,630 ms |
| Score | 1526 |
1520 |
| Total score | 3817 |
|
Copy Performance Test
A common everyday situation is simulated here. Three test folders are created:
- ISO (folder with two large files)
- Program (folder with many small files)
- Game (folder with small and large files)
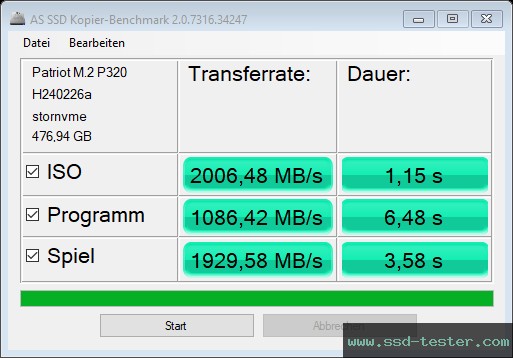
The three folders are copied using the Windows Copy command (the cache remains enabled). The practical test of March 26, 2025 shows the performance for simultaneous write and read operations. The lower the duration, the better the performance.
| AS SSD Copy-Benchmark | Transfer rate: | Duration: |
|---|---|---|
| ISO two large files |
2006,48 MB/s |
1,15 s |
| Program many small files |
1086,42 MB/s |
6,48 s |
| Game small and large files |
1929,58 MB/s |
3,58 s |
Compression Performance Test
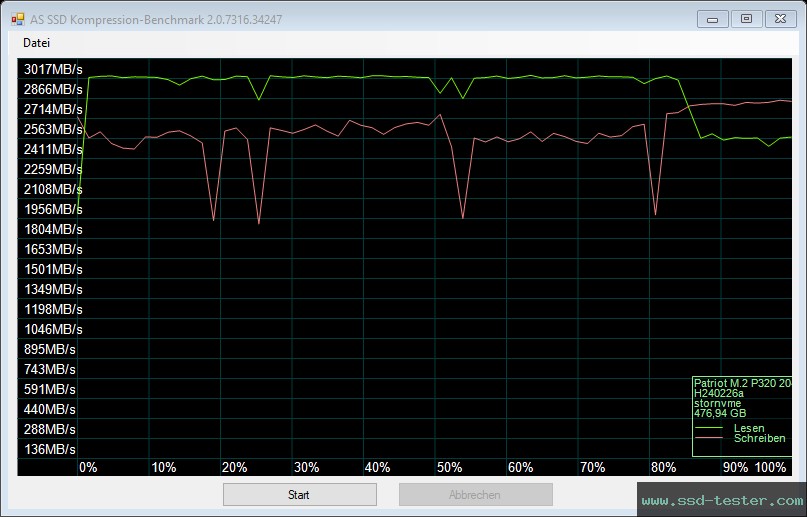
This measures the write and read speed of the Patriot SSD, depending on the compressibility of the data (according to the manufacturer, these should be 3000 MB/s and 2200 MB/s respectively ).
CrystalDiskMark Benchmark
Here, two sequential and two random performance tests are performed, similar to the ones performed on the AS SSD.
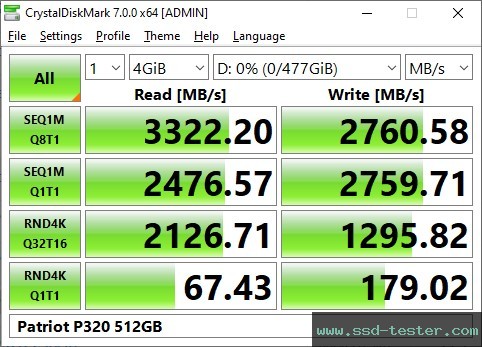
| CDM | Read [MB/s] | Write [MB/s] |
|---|---|---|
| SEQ1M Q8T1 |
3322,21 |
2760,58 |
| SEQ1M Q1T1 |
2476,57 |
2759,71 |
| RND4K Q32T16 |
2126,71 |
1295,82 |
| RND4K Q1T1 |
67,43 |
179,02 |
Input/Output operations per second
| CDM | Read [IOPS] | Write [IOPS] |
|---|---|---|
| SEQ1M Q8T1 |
3.168,30 |
2.632,70 |
| SEQ1M Q1T1 |
2.361,80 |
2.631,90 |
| RND4K Q32T16 |
519.217,00 |
316.361,00 |
| RND4K Q1T1 |
16.461,40 |
43.706,30 |
Average latency
| CDM | Read [µs] | Write [µs] |
|---|---|---|
| SEQ1M Q8T1 |
2.522,69 |
3.032,97 |
| SEQ1M Q1T1 |
423,22 |
379,67 |
| RND4K Q32T16 |
984,32 |
1.616,65 |
| RND4K Q1T1 |
60,64 |
22,76 |
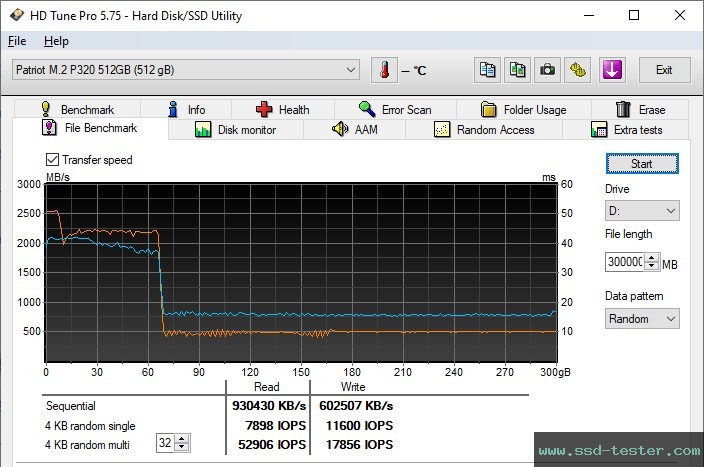
HD Tune Pro Endurance test
This is a long term test to make full use of the memory capacity. You can see when a cache is full and the writing performance decreases.
A test file of 300 GB was written to the medium.
After approx. 64 GB, the pSLC-Cache was full and the performance was throttled.
The average read speed was 930 MB/s and the average write speed was 603 MB/s.
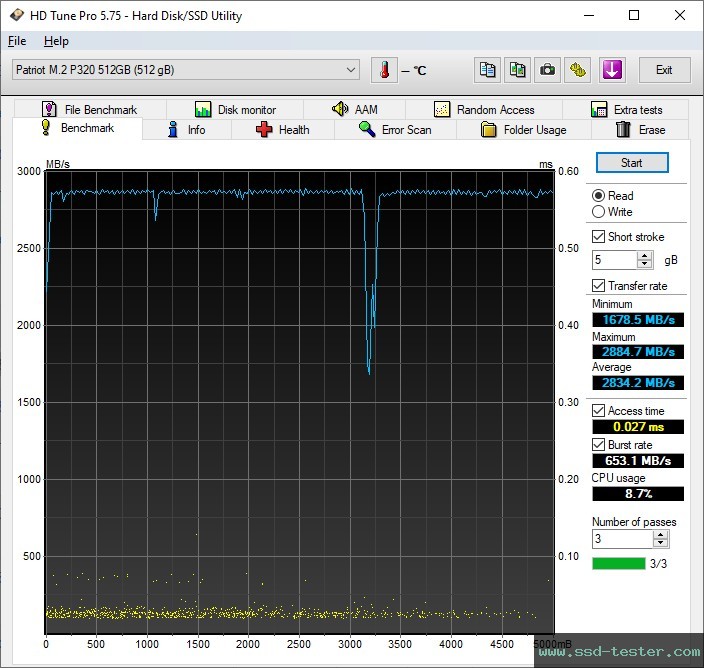
HD Tune Pro Benchmark
HD Tune writes a 5 GB file to the Patriot M.2 SSD. The transfer data of the read speed is displayed graphically. The minimum, maximum and average values are also determined. The determined access time and burst rate are also displayed.
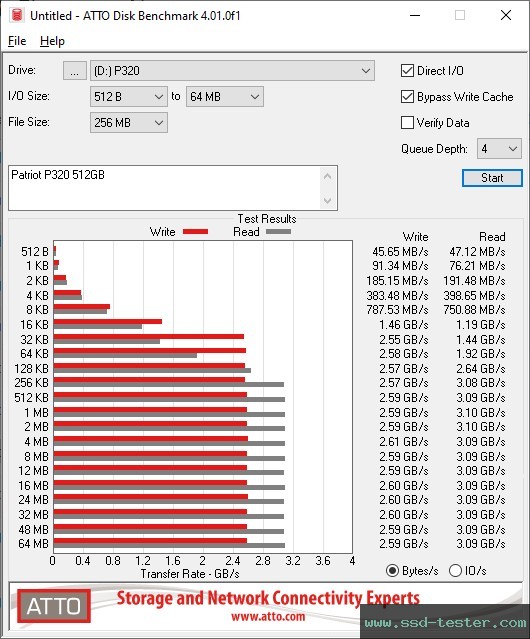
ATTO Disk Benchmark
Here, a 256 MB file is written several times to the Patriot M.2 SSD. The I/O block size varies (from 512 bytes to 64 megabytes). The larger the blocks, the faster they were written and read.
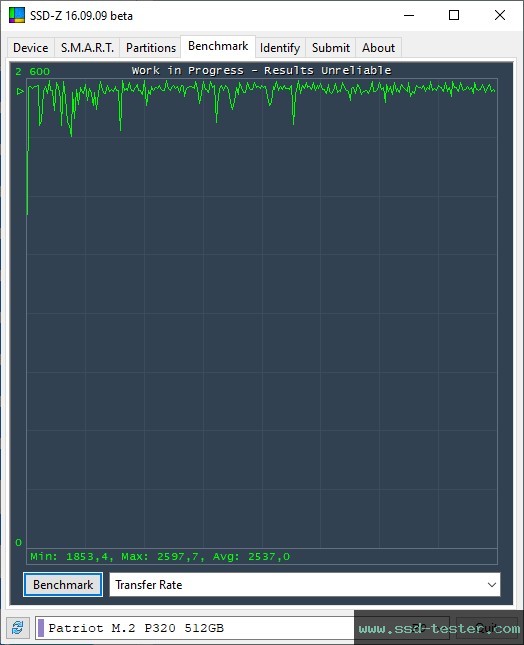
SSD-Z Benchmark
Similar to HD Tune, a 500 MB file is written to the Patriot M.2 SSD here. The transfer data is displayed. The more constant the line, the better.
Information about the test system can be found at the bottom of the home page.
As an Amazon Associate I earn from qualifying purchases.